Basic specifications
| Read-compatible model | PW3360/3365 series, 3169 series |
|---|---|
| Supported computer OS | Computer running under Windows 8/8.1 (32/64bit), Windows 7 SP1 or later (32/64bit), Windows Vista SP2 or later (32bit), or XP SP3 or later (32bit) |
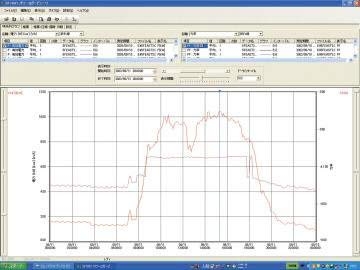
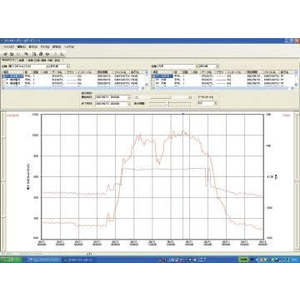
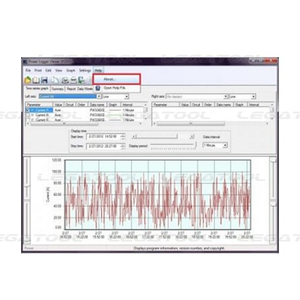
| Trend graph display function | [Display item] Voltage, current, active power, reactive power, apparent power, power factor, frequency, integrated active power, integrated reactive power, demand volume, demand value, voltage disequilibrium factor, Pulse, Harmonics (level, content, phase angle, total value, THD) [Stacked bar graph display] Up to 16 types of data series can be displayed in an overlay graph [cursor measurements] Measurement values can be displayed by the cursor |
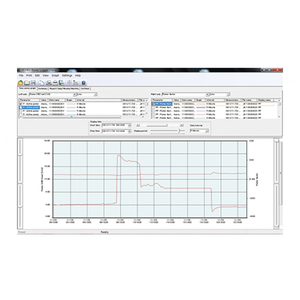
| Summary Display Function | Displayed items are the same as for Trend Graph Display [Daily, weekly and monthly report displays]: Accumulates and displays daily, weekly and monthly reports over specified period. [Load factor calculation display]: Calculates and displays load factor and demand factor results with daily, weekly and monthly reports [Time span aggregation]: Aggregates data into up to four specified time spans |
| Waveform display | Displays waveform data at specified data |
| Harmonic display | [List display]: Displays a list of harmonic data at specified date [Graph display]: Displays a bar graph of harmonic data at specified date [Cursor calculation]: Calculates measurement data at cursors in waveform and graph displays |
| Copy function | Captures any display image to the clipboard |
| Print Function | Preview and print content shown on the trend graph, report, harmonic graph and settings displays. [Comment entry]: (Text comments can be entered in any printout) [Header/Footer settings]: Sets the header and footer for each printout [Printing support]: Any color or monochrome printing supported by the operating system |
| Report printing | Print (static) contents over a specific time period [Output contents]: Standard or selected output items [Available output items]: Trend graph, summary, daily report, harmonic list, harmonic graph, waveform [Report creation method]: Standard print [Report output settings]: Save/load report output settings |